The Evolution of Observability
When I started in the late ’90s, everything seemed so clunky by today’s standards. I was part of the team at IBM building a platform for TUI, an online travel platform. Back then, getting an app to run smoothly with high user traffic was like trying to tame a wild horse. We relied heavily on early APM solutions like Wily to peer inside our applications. Over time, other solutions came along, such as Splunk, Dynatrace, Instana, Lightstep, and many others.
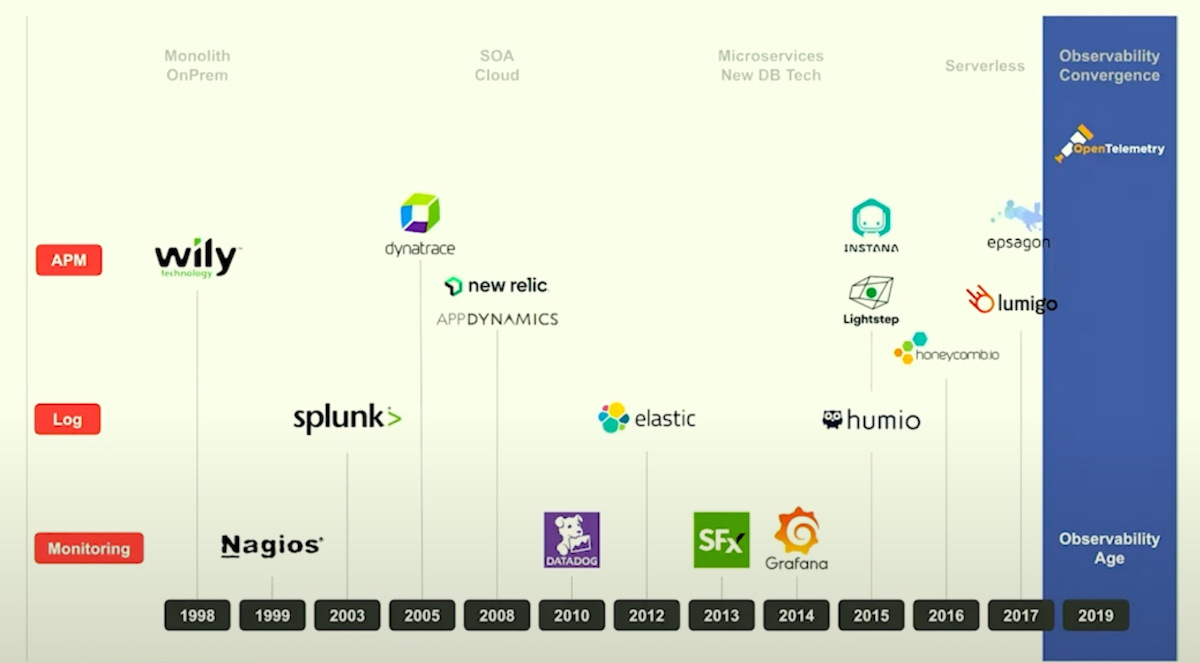
Fast forward a couple of decades, and we’ve transitioned from siloed tools to the more integrated platforms we have today - many of which were born out of the necessity to manage the complexity of systems like Kubernetes and microservices.
Introducing OpenTelemetry
Here’s where OpenTelemetry comes into play. Founded on the principles of interoperability and standardization, it simplifies how observability data - metrics, logs, and traces - are generated and collected, minus the proprietary lock-in of yesteryears. It’s a CNCF open-source project that introduced significant changes for the end-user by merging different standards together.
So, what exactly is OpenTelemetry?
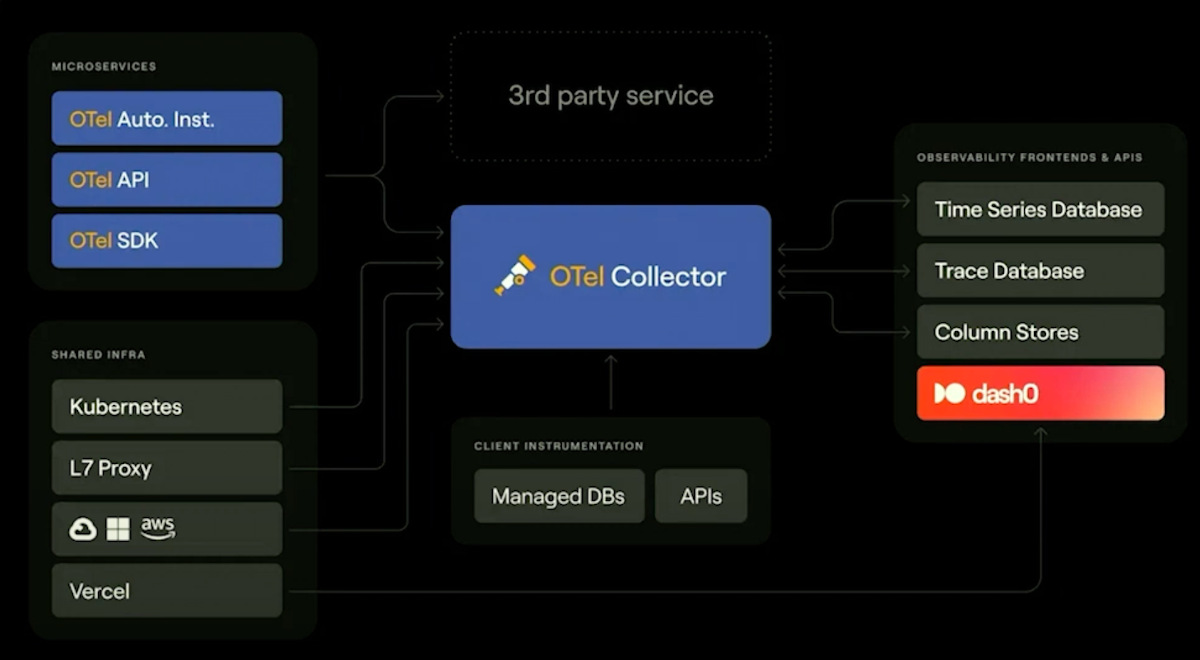
It’s neither a tool you can just use out of the box nor a data store to hoard telemetry data. Rather, it’s a suite of APIs, SDKs, and auto-instrumentation agents that standardize how telemetry data is captured. This makes it easy to switch between different tools like Grafana, Datadog, or Elastic without being hindered by unique data formats or vendor-specific implementation.
Since OpenTelemetry is open-source, developers can freely take the SDK and inject traces, logs, and metrics directly into their code. OpenTelemetry is compatible with many vendors, as nearly every major observability tool now supports OpenTelemetry data. This compatibility allows developers to get telemetry data even from serverless environments where traditional agents can’t be installed.
Why Does This Matter?
Today, no one wants to be tied down by vendor lock-in. Open standards like OpenTelemetry shield us from this by ensuring our observability strategies are as flexible and future-proof as possible. As Kubernetes and distributed architectures get more intricate, it is crucial to have a unified language for telemetry - making it easier to troubleshoot when unknown unknowns pop up. One thing to watch out for, though, is managing data cardinality - or the dimensionality of your collected data. High cardinality, like appending unique user IDs to every metric, can spiral into both performance and cost issues. So, remember to choose your tags wisely!
The Power of Context in Observability
The real magic happens when you add context to your telemetry data - transforming raw data into actionable insights. With OpenTelemetry’s semantic conventions, we can harmonize observability data across services, making it possible to unify logs, traces, and metrics into a single coherent narrative. Imagine effortlessly tracing a request from user interaction to a backend service while understanding all intervening components’ performance - now, that’s powerful.
Getting Started with OpenTelemetry on Kubernetes
For those running Kubernetes, integrating OpenTelemetry is surprisingly straightforward. Deploy an OpenTelemetry Collector as a DaemonSet or use the new Kubernetes Operator available to the community. With automatic and manual instrumentation options, it’s never been easier to gain comprehensive visibility across your stacks.
Beyond OpenTelemetry
Using OpenTelemetry doesn’t mean you can’t incorporate other technologies you love. In fact, it complements them. Whether you’re using Prometheus for metrics or using Elastic for log analysis, OpenTelemetry makes it possible to create robust, scalable observability stacks that leverage the best of what’s available. Observability is more than seeing what your systems do - it’s understanding why they do it. OpenTelemetry offers a shared language to describe complex systems. By embracing this tool, you’re not only future-proofing your observability strategies but also empowering your team to tackle the unknowns of tomorrow.
For more details, watch the full talk at ContainerDays Conference 2024: Kubernetes Observability with OpenTelemetry - Mirko Novakovic.
A Bit About Me
I’m the co-founder and CEO of Dash0, but my ventures into observability go way back. I was part of the founding team at Instana, where we pioneered APM specifically for Kubernetes. We later sold Instana to IBM in 2020. Post-acquisition, I’ve invested as an angel in over 70 SaaS startups that are just as passionate about innovation as I am!